Excerpt from globalwarming.org: The IPCC’s 2007 Fourth Assessment Report (AR4) estimated a “likely” ECS range of 2°C-4.5°C, with a “best estimate” of 3°C. Since 2011, however, the warming pause and the growing divergence of model predictions and observed global temperatures have been the impetus for several studies finding that IPCC sensitivity estimates are too hot.
Cato Institute scientists Patrick Michaels and Chip Knappenberger maintain a growing list of such studies, which totaled 18 as of February 2014:

The average sensitivity estimate of the 18 studies compiled by Michaels and Knappenberger is just under 2°C. In other words, the IPCC AR4 “best estimate” of 3°C is 50% higher than the mean estimate of the new studies. That may be why the IPCC’s 2013-2014 Fifth Assessment Report (AR5) declines to offer a “best estimate.”
A new “best estimate” of 2°C would deflate the scary climate change impacts featured elsewhere in AR5, but recycling the same old 3°C “best estimate” would deflate the IPCC’s claim to be an honest broker. So instead the IPCC chose to lower the low end of the “likely” sensitivity range. Whereas the “likely” range in AR4 was 2°C-4.5°C, in AR5 it is 1.5°C-4.5°C.
That small concession, however, does not dispel the growing challenge to consensus climatology. As indicated in the Michaels and Knappenberger chart above, the average sensitivity of the climate models used in AR5 is 3.2°C. That is 60% higher than the mean of recent estimates (< 2°C).
An additional 21 peer-reviewed papers based upon observations and compiled by the Hockey Schtick find even lower ECS estimates of < 1C, about 7 times less than claimed by the IPCC. In total, there are now at least 37 published, peer-reviewed studies compiled by Michaels, Knappenberger, and the HS finding climate sensitivities significantly less than claimed by the IPCC. In contrast, there is a drought of studies finding climate sensitivities higher than claimed by the IPCC AR5 mean modelled estimate of 3.2C.
The new paper below finds an ECS of 1.8C, but does not consider natural changes in ocean oscillations, cloud cover, global "brightening" & "dimming," which can alone explain all of the post-1950 warming. The paper also uses long-term ocean heat content [OHC] data as the basis of the ECS calculation, but the OHC trends have been determined to be exaggerated due to sampling biases in a paper published this week. The paper also does not consider the possibility of solar amplification mechanisms, which can explain 95% of climate change over the past 400 years. Consideration of these 4 factors would further lower the ECS estimates significantly.
A description of the paper from the Swedish Stockholm Initiative site is below [Google translation], followed by the abstract and full paper in English.
Norwegian research team got climate sensitivity (ECS) between 0.9 and 3.2 degrees C
The Norwegian research team consists of climate scientists and statistical mathematician. They have used every conceivable observations, together with a relatively simple climate model, a so-called energy balance model in which climate sensitivity is one of the input parameter values. They have adjusted the parameter values of the climate model to observations using Bayesian statistics. They were then equilibrium climate sensitivity (ECS = Equilibrium Climate Sensitivity) to 1.8 degrees C (0.9 to 3.2 degrees C with 90% probability) for the doubling of carbon dioxide levels.
The article of Skeie et al. (2014) is published in the geosciences journal Earth System Dynamics.Three of the authors belong climate research center CICERO, University of Oslo, Terje Berntsen ,Gunnar Myhre and Ragnhild Bieltvedt Skeie . The other two authors are statistical mathematician belonging Norsk Regnesentral, Marit Holden and Magne Aldrin .
It inspires confidence that climate scientists here collaborates with statistical mathematician who is proficient in Bayesian statistics . The idea is to use a climate model that includes climate sensitivity as a parameter and to find out the value of climate sensitivity by adapting the model to the observed data. To do this properly with Bayesian statistics needed the expertise of statistical mathematics.
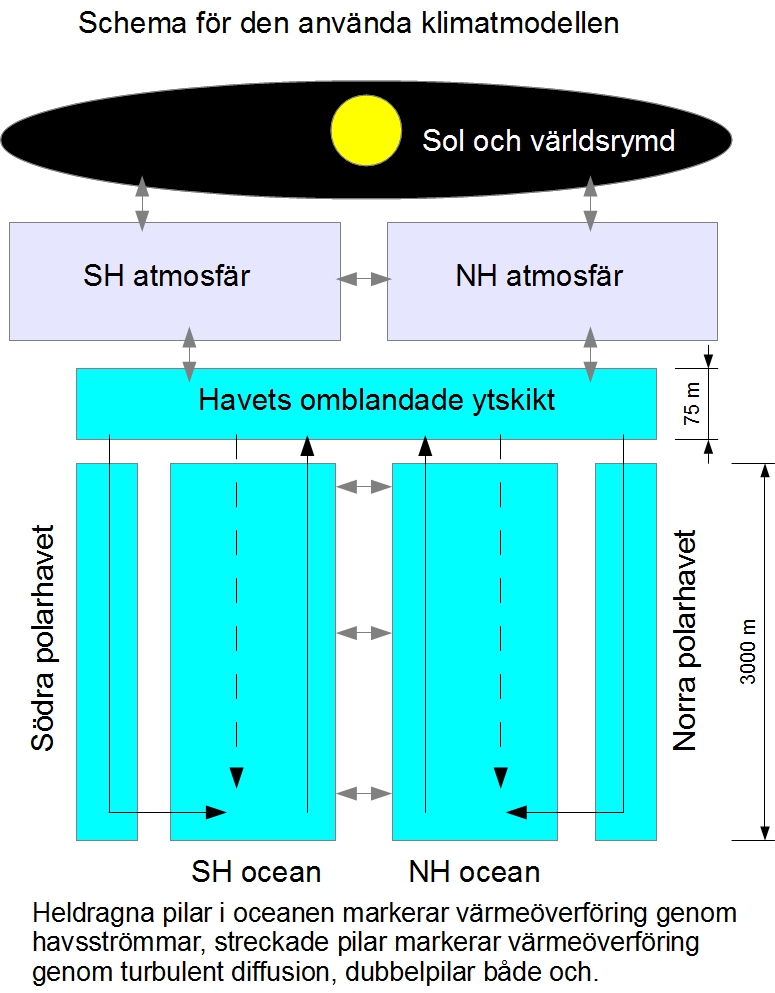
Magne Aldrin (2010) has given a presentation of the methods that they use at a workshop in Cambridge, UK in 2010. The simple climate model is not of the simplest kind, the atmosphere is divided into northern and southern hemispheres. The model ocean is still more complicated and divided into the southern polar ocean, the southern hemisphere's main body, the northern hemisphere's body and the northern polar ocean. The following figure gives an approximate schedule for this climate model (the dimensions listed are only possible examples).
This simple climate model , according to previous studies cited in Skeie et al. (2014) have been able to reproduce the simulations with advanced climate models. The reason for for this kind of adaptation of the model parameters to the observed data are not using an advanced climate model directly, is that such models are very complex and require too much computing power. One way to solve this problem is to do what the writers have done, using a simple model that has been confirmed by simulation can reproduce sophisticated climate model results.
Climate model includes climate sensitivity at equilibrium (ECS = Equilibrium Climate Sensitivity) as an unknown parameter, and six additional parameters related to the heat flows into the ocean to do. You also need radiation exchange between the atmosphere and the upper and solar. This type of data is called "radiative forcing" and that climate science has devoted considerable effort to determine, but the uncertainties in the data are still large. As is known, the impact of increased levels of greenhouse gases in the atmosphere, which mainly affects the "radiative forcing" and that they have pretty good data as well as changed aerosol influence and where the uncertainty is much larger.
Has values of these seven parameters and a graph of how the "radiative forcing" has varied with time since pre-industrial times so this simple climate model to figure out how the temperature has varied in both the northern and southern hemispheres, and how the heat content of the ocean has changed. You can then modify the parameter values, whereby man is above all interested in climate sensitivity, within the possible limits of error, and also vary the "radiative forcing" within their error limits. In this way, one can see for what combinations of parameter values to obtain curves for the temperatures and ocean heat content, which agrees with observations. This is what is called the parameter adjustment .
It's such a parameter adjustment statistical mathematician can help with making in a professional manner and really exploit the knowledge of Bayesian methods to get the best possible results. In this way one can determine a probability interval for climate sensitivity, in this case one can say about the ECS that the most likely value is 1.8 degrees C for a doubling of carbon dioxide and that with 90% probability value lies between 0.9 and 3.2 degrees C (compared to the UN Climate Change (IPCC) range to the 66-100% probability value lies between 1.5 and 4.5 degrees C).
The observations that the authors have used for their study is part six temperature series: HadCRUT3, NCDC and GISS for the northern and southern hemisphere (there is a significant body of scientific work that has taken a long time to implement, why not HadCRUT4 been used throughout, but only for a supplemental analysis ), and data for ocean heat content from Levitus research team at NOAA and two other research groups. So it is incredibly much data as adapting the model parameters to. It has also, as is possible in a Bayesian analysis, taken with data for ocean parameters based on independent observations as input data (so-called "prior probability distribution").
The result for the equilibrium sensitivity ECS is low, 1.8 degrees C for a doubling of carbon dioxide levels, but especially noteworthy is that the uncertainty interval, 0.9 to 3.2 degrees C, is shorter than in other similar studies. Compare, for example, with the much talked about recently published study by Lewis and Curry who were 1-4 degrees C.
The authors therefore studied how the results varied with the data ended. If they used data only up to 2000, they received a slightly higher climate sensitivity, but above all was the uncertainty range for much longer.
They suggest thereof an explanation of why this is so. This is partly due to "radiative forcing" has risen significantly during the past decade, so that the relative error of this has diminished. The second contributing factor is the availability of data for the heat content of the ocean has increased by 20% (depending on the test series starting about 1950). They say not to the reduced length of the uncertainty interval would have to do with heating the break.
The transient climate sensitivity is also of interest because it is this which, in theory, primarily determines the temperature will increase with increased greenhouse gas concentrations within 50 to 100 years. It uses as a measure of the climate sensitivity of the temperature increase due to how the temperature is affected by a change in the carbon content of 1% per year (ie 400 ppm increase in one year to 404 ppm). Climate sensitivity measure is called TCR (Transient Climate Response) and indicates the temperature rise at the time when carbon dioxide levels doubled, with 1% annually takes about 70 years.
Skeie et al. got the TCR value 1.4 degrees C with 90% probability that the value is in the range 0.8-2.2 degrees C. Even in this case was the uncertainty interval longer, almost 70% increase, if only the data up to 2000 were used .
The most exciting aspect of this very reassuring study, I think, is the already mentioned comparison with the UN climate panel climate sensitivity range, ie that climate sensitivity is likely, with 66-100% probability, is between 1.5 and 4.5 degrees Celsius . The latest scientific summary for policy makers (Summary for Policymakers, SPM) writes more accurately:
Equilibrium climate sensitivity is likely in the range 1.5 ° C to 4.5 ° C (high confidence), Extremely Unlikely less than 1 ° C (high confidence), and very Unlikely Greater Than 6 ° C (medium confidence).
(Likely = 66-100% probability, Extremely Unlikely = 0-5%, Very Unlikely = 0-10%).
This present study has instead concluded that with 90% probability is climate sensitivity between 0.9 and 3.2 ° C . The difference from the UN Climate Panel range of 1.5-4.5 degrees C is remarkable.
References
Skeie RB, Berntsen T, Aldrin M, Holden M, Myhre G (2014) A lower and more constrained estimate of climate sensitivity using updated observations and detailed radiative forcing time series . Earth Syst Dyn 5: 139-175. doi: 10.5194 / esd-5-139-2014
Aldrin M. (2010) Bayesian estimation of the climate sensitivity based on a simple climate model fitted to global temperature observations . Cambridge Workshop, December 2010.
Earth Syst. Dynam., 5, 139-175, 2014
www.earth-syst-dynam.net/5/139/2014/ doi:10.5194/esd-5-139-2014 |
1Center for International Climate and Environmental Research – Oslo (CICERO), Oslo, Norway
2Department of Geosciences, University of Oslo, Oslo, Norway
3Norwegian Computing Center, Oslo, Norway
4Department of Mathematics, University of Oslo, Oslo, Norway
Abstract. Equilibrium climate sensitivity (ECS) is constrained based on observed near-surface temperature change, changes in ocean heat content (OHC) and detailed radiative forcing (RF) time series from pre-industrial times to 2010 for all main anthropogenic and natural forcing mechanism. The RF time series are linked to the observations of OHC and temperature change through an energy balance model (EBM) and a stochastic model, using a Bayesian approach to estimate the ECS and other unknown parameters from the data. For the net anthropogenic RF the posterior mean in 2010 is 2.0 Wm−2, with a 90% credible interval (C.I.) of 1.3 to 2.8 Wm−2, excluding present-day total aerosol effects (direct + indirect) stronger than −1.7 Wm−2. The posterior mean of the ECS is 1.8 °C, with 90% C.I. [confidence interval] ranging from 0.9 to 3.2 °C, which is tighter than most previously published estimates. We find that using three OHC data sets simultaneously and data for global mean temperature and OHC up to 2010 substantially narrows the range in ECS compared to using less updated data and only one OHC data set. Using only one OHC set and data up to 2000 can produce comparable results as previously published estimates using observations in the 20th century, including the heavy tail in the probability function. The analyses show a significant contribution of internal variability on a multi-decadal scale to the global mean temperature change. If we do not explicitly account for long-term internal variability, the 90% C.I. is 40% narrower than in the main analysis and the mean ECS becomes slightly lower, which demonstrates that the uncertainty in ECS may be severely underestimated if the method is too simple. In addition to the uncertainties represented through the estimated probability density functions, there may be uncertainties due to limitations in the treatment of the temporal development in RF and structural uncertainties in the EBM.
Citation: Skeie, R. B., Berntsen, T., Aldrin, M., Holden, M., and Myhre, G.: A lower and more constrained estimate of climate sensitivity using updated observations and detailed radiative forcing time series, Earth Syst. Dynam., 5, 139-175, doi:10.5194/esd-5-139-2014, 2014.
Related:
http://dailycaller.com/2014/10/24/record-temperatures-highlight-lack-of-warming/
ReplyDeleteHello,
ReplyDeleteFYI, I just tried to log in to http://spielclimate.blogspot.com/, and the google returned a malware report.
Some sort of malicious mischief is going on there.
I use spielclimate quite often - so you know at least one person would miss it, if it went ghost.
Thanks for letting me know. According to Blogger and Google
Delete"Currently, we haven't detected any security issues with your site's content."
Apparently, one of the many sites spielclimate links to had some malware, but I have no idea which site that is. The spielclimate.blogspot.com site is free of malware, verified with
http://sitecheck.sucuri.net/results/spielclimate.blogspot.com
and Blogger/Google as clean. Hopefully, the Google will soon correct the malware alert. I will check in a couple days.
In the meantime, if you click on details at the bottom you can still visit the site and it should be fine. I've done so myself several times today with zero malware issues.
DeleteBelow find 40 peer-reviewed papers published in science journals by 120+ scientists that have low (2.0 C or less, 1.1 C median) climate sensitivity estimates (with ECS values highlighted below).
ReplyDeletehttp://www.nature.com/ngeo/journal/v6/n6/full/ngeo1836.html
2.0 (17 scientists, 14 of them IPCC Lead Authors)
http://link.springer.com/article/10.1007%2Fs00382-012-1375-3?LI=true
2.0
http://folk.uio.no/gunnarmy/paper/aldrin_env_2012.pdf
2.0
http://www.klimatupplysningen.se/wp-content/uploads/2014/01/Bengtsson-Tellus.pdf
2.0
http://www.sciencedirect.com/science/article/pii/S0304380014000404
1.99
http://link.springer.com/article/10.1007%2Fs00382-013-1770-4
1.9
http://www.int-res.com/articles/cr2003/23/c023p001.pdf
1.9
http://www.atmos.washington.edu/~mzelinka/Forster_etal13.pdf
1.8
http://www.earth-syst-dynam-discuss.net/4/785/2013/esdd-4-785-2013.html
1.8
http://www.iac.ethz.ch/doc/publications/Chylek-Lohmann-GRL2008-comment.pdf
1.8
http://www.earth-syst-dynam.net/5/139/2014/esd-5-139-2014.html
1.8
http://file.scirp.org/Html/24283.html
1.7
http://link.springer.com/article/10.1007/s00382-014-2342-y
1.64
http://www.princeton.edu/~gkv/papers/Padilla_etal11.pdf
1.6 (TCR)
http://onlinelibrary.wiley.com/doi/10.1029/2011GL050226/abstract
1.55 (TCR)
http://journals.ametsoc.org/doi/abs/10.1175/JCLI-D-12-00473.1
1.6
http://people.duke.edu/~ns2002/pdf/EARTH_1890.pdf
1.5
http://arxiv.org/pdf/1307.3706.pdf
1.35
http://www.earth-syst-dynam-discuss.net/5/529/2014/esdd-5-529-2014.html
1.3
http://link.springer.com/article/10.1007/s13143-014-0011-z
1.3
http://www.clim-past-discuss.net/8/4923/2012/cpd-8-4923-2012.html
1.1
http://www.pas.rochester.edu/~douglass/papers/published_E&E%20douglass_christy.pdf
1.1
http://multi-science.metapress.com/content/k76363u651167q65/
0.96
http://www.earth-syst-dynam-discuss.net/4/25/2013/esdd-4-25-2013.html
0.67
http://www-eaps.mit.edu/faculty/lindzen/236-Lindzen-Choi-2011.pdf
0.67
http://www.drroyspencer.com/Spencer-and-Braswell-08.pdf
0.67
http://www.drroyspencer.com/wp-content/uploads/Spencer_Misdiagnos_11.pdf
0.62
http://www.scipublish.com/journals/ACC/papers/846
0.60
http://www.sciencedirect.com/science/article/pii/S1364682612001617
0.53
http://multi-science.metapress.com/content/3678681q807n8236/fulltext.pdf?page=1
0.51
http://www.iac.ethz.ch/doc/publications/Chylek-et-al-JGR2007-climate-sens.pdf
0.50
http://link.springer.com/article/10.1007%2FBF01592922
0.50
http://www.int-res.com/articles/cr/10//c010p069.pdf
0.40
http://www.ecd.bnl.gov/steve/pubs/HeatCapacity.pdf
0.39
http://journals.ametsoc.org/doi/pdf/10.1175/1520-0450%281979%29018%3C0822%3AQCTPIO%3E2.0.CO%3B2
0.30
http://onlinelibrary.wiley.com/doi/10.1029/2006GL026355/abstract
0.29
http://www.klimatupplysningen.se/wp-content/uploads/2009/03/paltridgearkingpook.pdf
0.26
http://www.pas.rochester.edu/~douglass/papers/DK_reply_PLA_2012.pdf
0.21
http://www.sciencedirect.com/science/article/pii/S0160412008001232
0.02
http://atlatszo.hu/wp-content/uploads/2011/07/article.pdf
0.00